Marketing Campaign Analysis Dashboard
Facebook, Instagram and Pinterest unified in Fabric — showing the lowest-CTR channel was actually returning 75% more revenue per conversion.
Microsoft Fabric · Power BI Development · Multi-Channel Ad Performance
THE BUILD
click any screen to enlarge
My role
BI Consultant & Data Analyst — end-to-end from ad platform data to a live, client-connected dashboard
The challenge
A business running paid campaigns across Facebook, Instagram and Pinterest had no unified way to compare performance across channels. Each platform's native reporting showed its own numbers in isolation. There was no single view to answer which channel was most cost-efficient, which campaigns or cities converted best, or where ad spend should be reallocated. Marketing decisions were being made channel by channel instead of holistically.
The data problem
Campaign data lived separately in each ad platform's own reporting, each with its own metrics structure, naming conventions and granularity across channel, campaign, device, city and ad creative. There was no consistent way to compare cost per conversion or revenue per conversion across platforms, no unified CTR calculation, and no single source combining spend, clicks, impressions and revenue into one comparable model.
My approach
I built a Data Factory pipeline in Microsoft Fabric to pull campaign data directly from each ad platform on a schedule, landing it in a Fabric Lakehouse rather than relying on manual exports. From there I used Dataflows Gen2 and SQL in the Fabric Warehouse to reconcile platform-specific differences, standardizing metric definitions — impressions, clicks, CTR, conversions, spend, revenue — so the three platforms could be compared on equal footing for the first time.
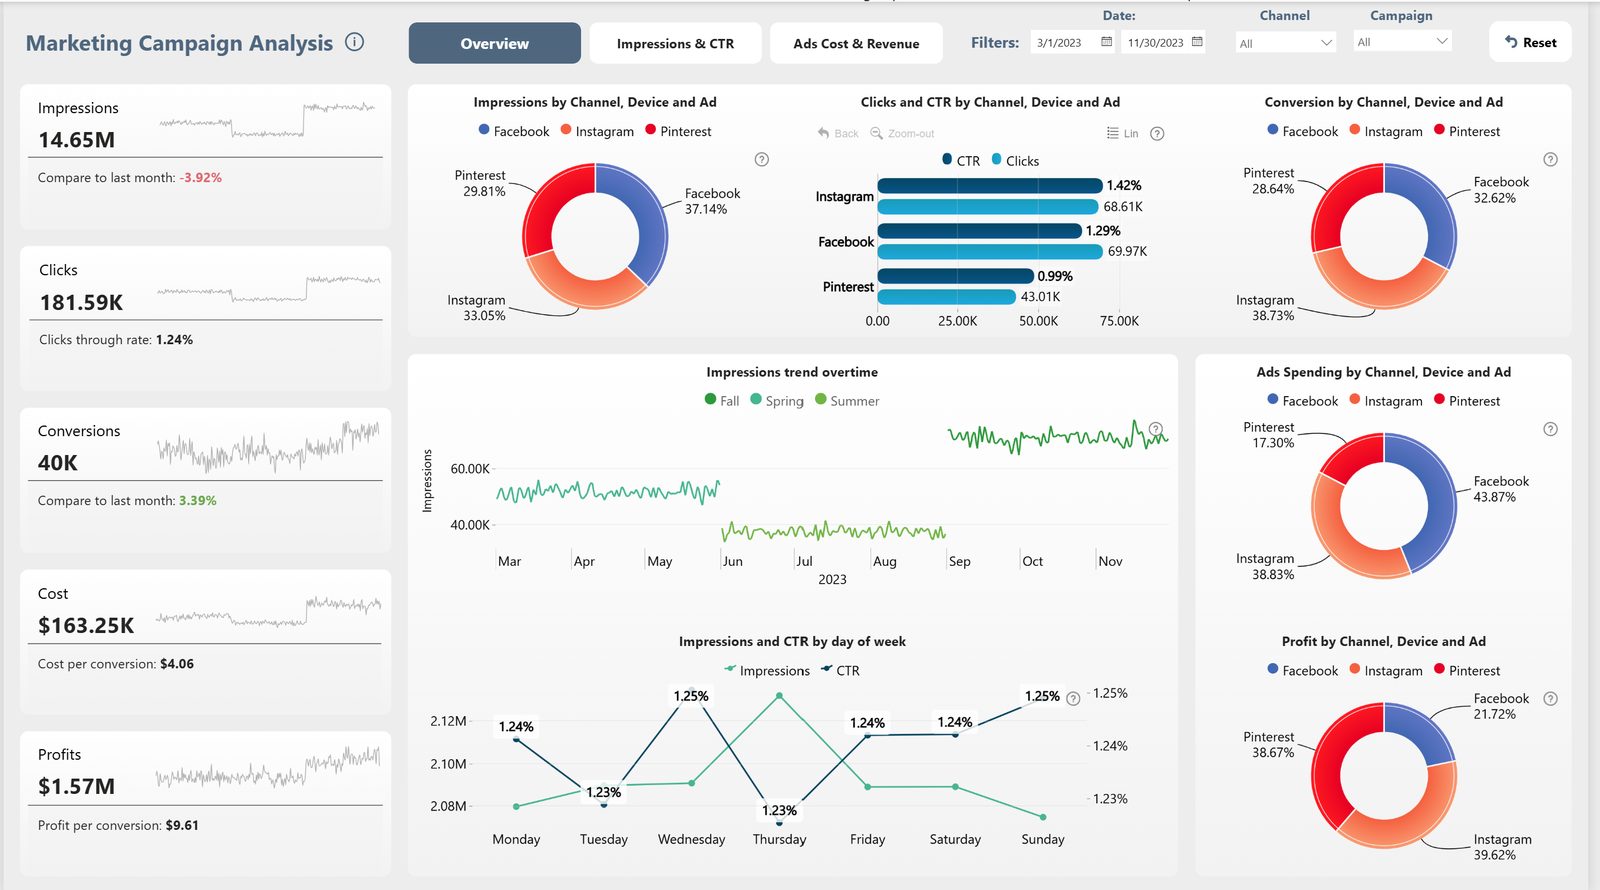
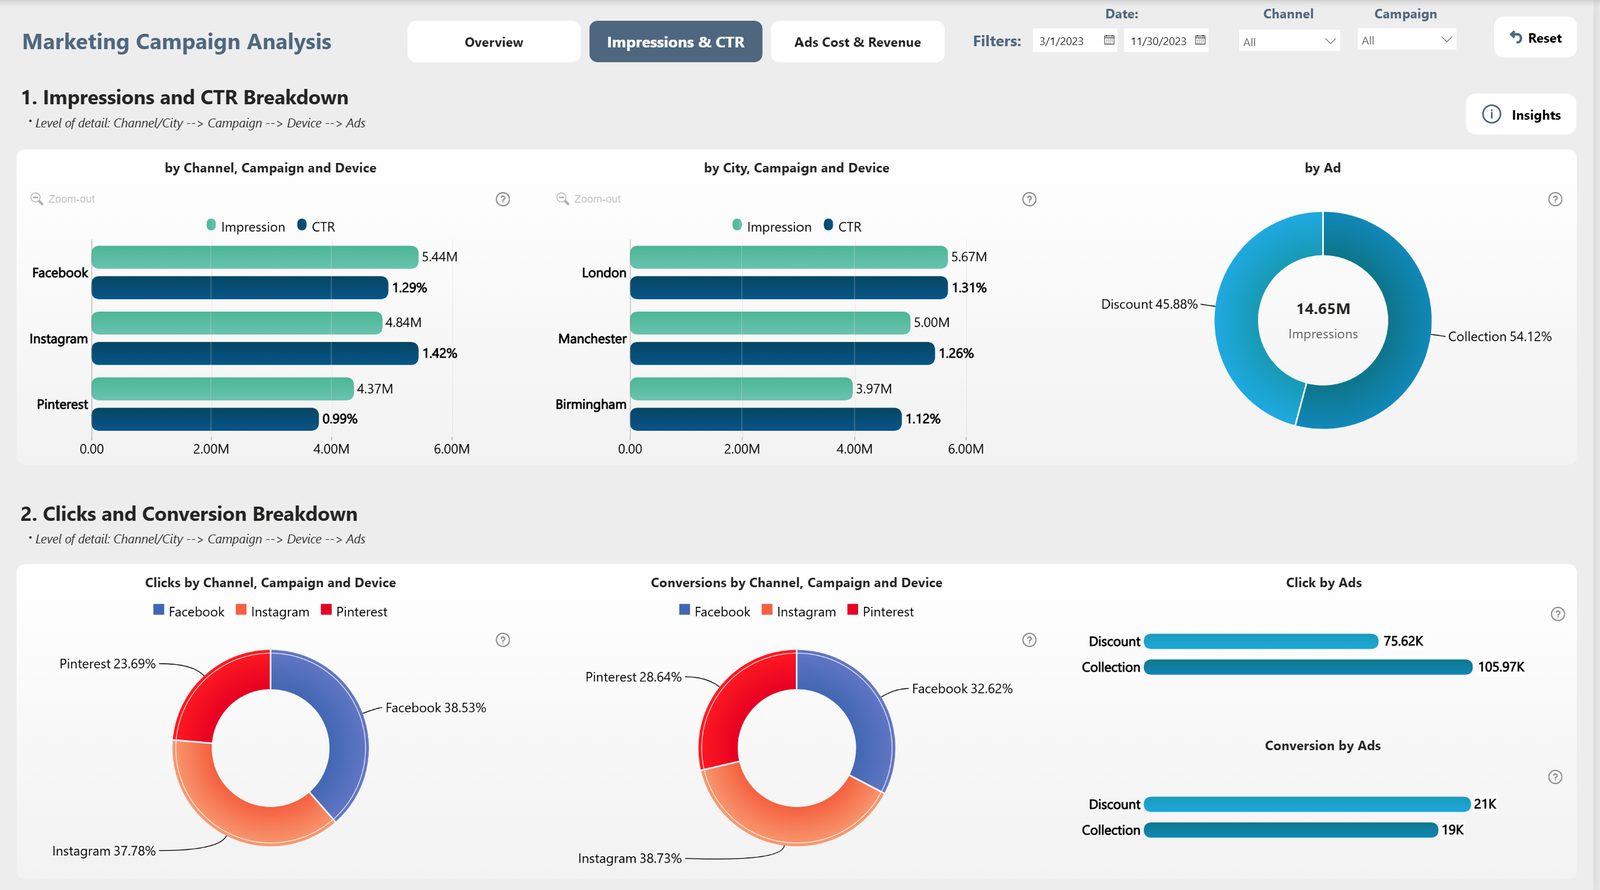
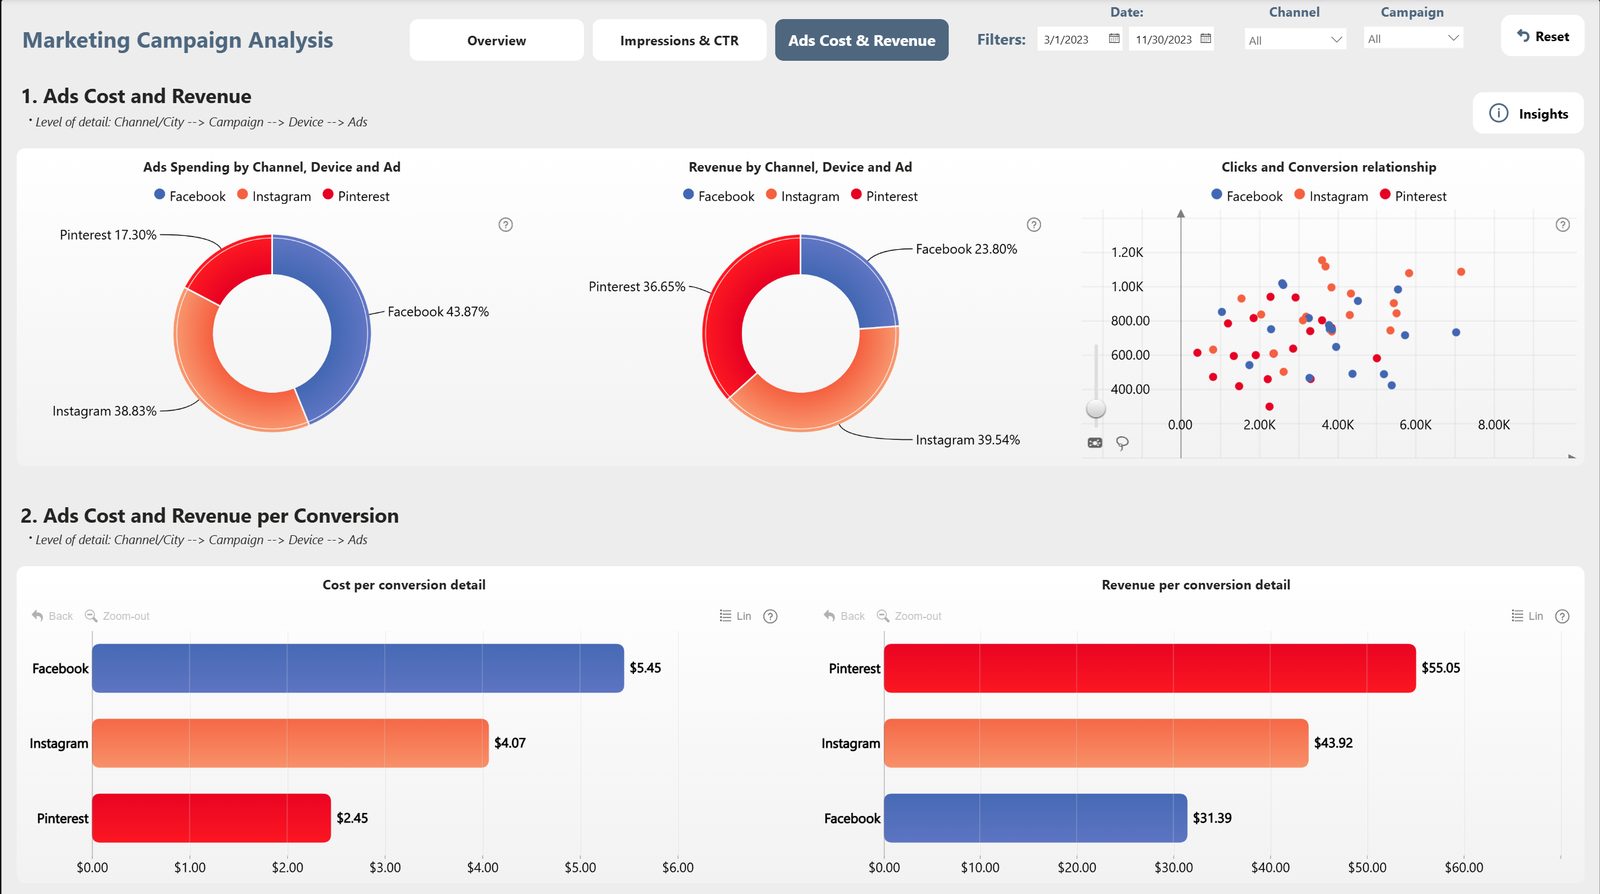
With the data modeled into a consistent star schema, Power BI connected natively to the Warehouse and I built three focused views: an Overview page for a fast executive read with trend sparklines and month-over-month comparisons, an Impressions & CTR page drilling from channel down through city, campaign and device to surface where engagement was strongest, and an Ads Cost & Revenue page built specifically to answer the efficiency question — cost per conversion and revenue per conversion by channel, so spend is judged against actual return rather than raw volume.
I built DAX measures for the drill-down hierarchies (Channel/City → Campaign → Device → Ad) so users can zoom from a top-line comparison to individual ad performance without separate reports, and added a clicks-versus-conversion scatter plot to surface which campaigns convert efficiently relative to their click volume. The dashboard is live and connected to the client's ad accounts through the Fabric pipeline, so data refreshes automatically.
The result
The dashboard gave the client a true cross-channel comparison for the first time. It revealed that despite Pinterest driving the lowest click-through rate (0.99% versus Facebook's 1.29% and Instagram's 1.42%), it delivered the highest revenue per conversion at $55.05 — more than 75% above Facebook's $31.39. Pinterest traffic converted at a much higher value even though it generated less volume. That insight directly challenged an engagement-first view of channel performance and gave the client a concrete case for rebalancing budget toward value per conversion rather than raw click volume.
Tools & tech stack
- Microsoft Fabric Data FactoryScheduled pipeline pulling campaign data from Facebook, Instagram and Pinterest ad accounts
- Fabric LakehouseStaging layer for raw multi-platform campaign data
- Dataflows Gen2 & T-SQLStandardizing metric definitions and reconciling platform reporting differences
- Power BI & DAXDrill-down hierarchies, cost/revenue-per-conversion measures, trend comparisons
- Power BI ServiceLive connection to the client's ad accounts through the Fabric pipeline
Have a problem that looks like this one?
Tell me what you're trying to decide or automate, and I'll tell you honestly what it would take.