CRM Pipeline Analysis Dashboard
REST API extraction into SQL Server, rebuilt as a star schema, exposing an 11.6% conversion rate and the exact stage where deals were dying.
Power BI Development · Data Extraction & Modeling · Sales Performance Analytics
THE BUILD
click any screen to enlarge
My role
BI Consultant & Data Analyst — end-to-end from raw CRM data to executive dashboard
The challenge
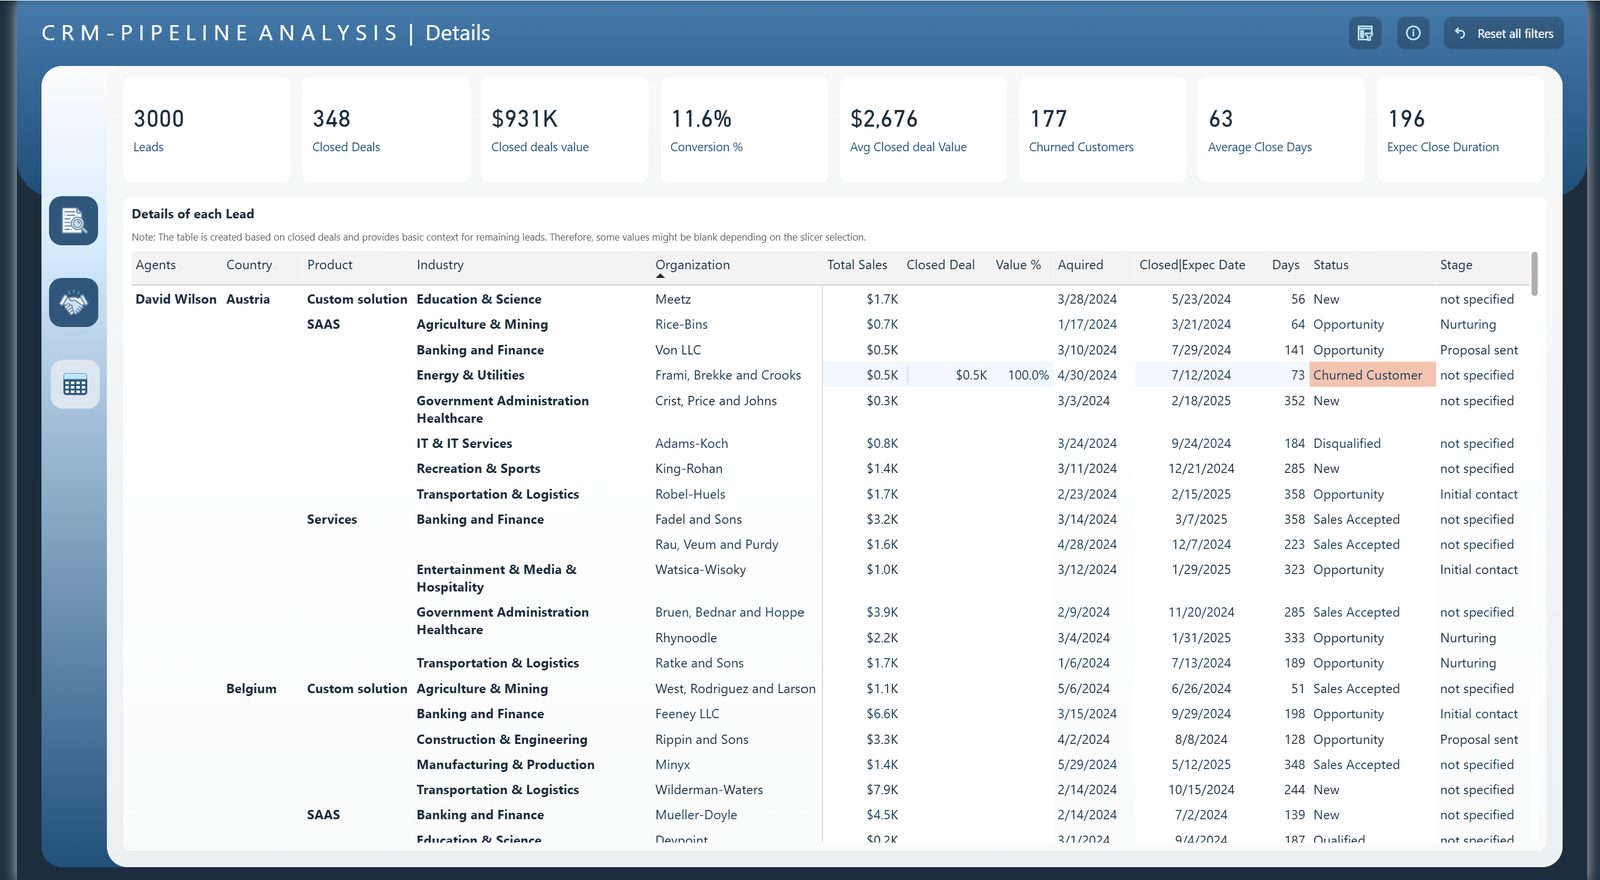
A growing sales organization was sitting on thousands of leads but had no real visibility into its own pipeline. Leadership couldn't answer basic questions: where are we actually losing deals? Which agents are driving results, and which aren't? Why is our conversion rate stuck? Decisions were being made from manual CRM exports that told a partial, outdated story.
The data problem
The CRM's built-in reporting only offered a flat, point-in-time snapshot with no historical stage tracking, no defined pipeline order and no location intelligence. To build something leadership could rely on, the data needed to be pulled at the source, stored properly and rebuilt from scratch.
My approach
I connected directly to the CRM's REST API to extract leads, deal stages, agent activity and status change history as live, structured datasets rather than depending on static manual exports. The extracted data was staged in a SQL Server database, where I handled the heavy cleaning and transformation before it ever touched the reporting layer: deduplication, null handling, standardizing inconsistent stage and status naming across agents, and queries to reshape the data into clean, analysis-ready tables.
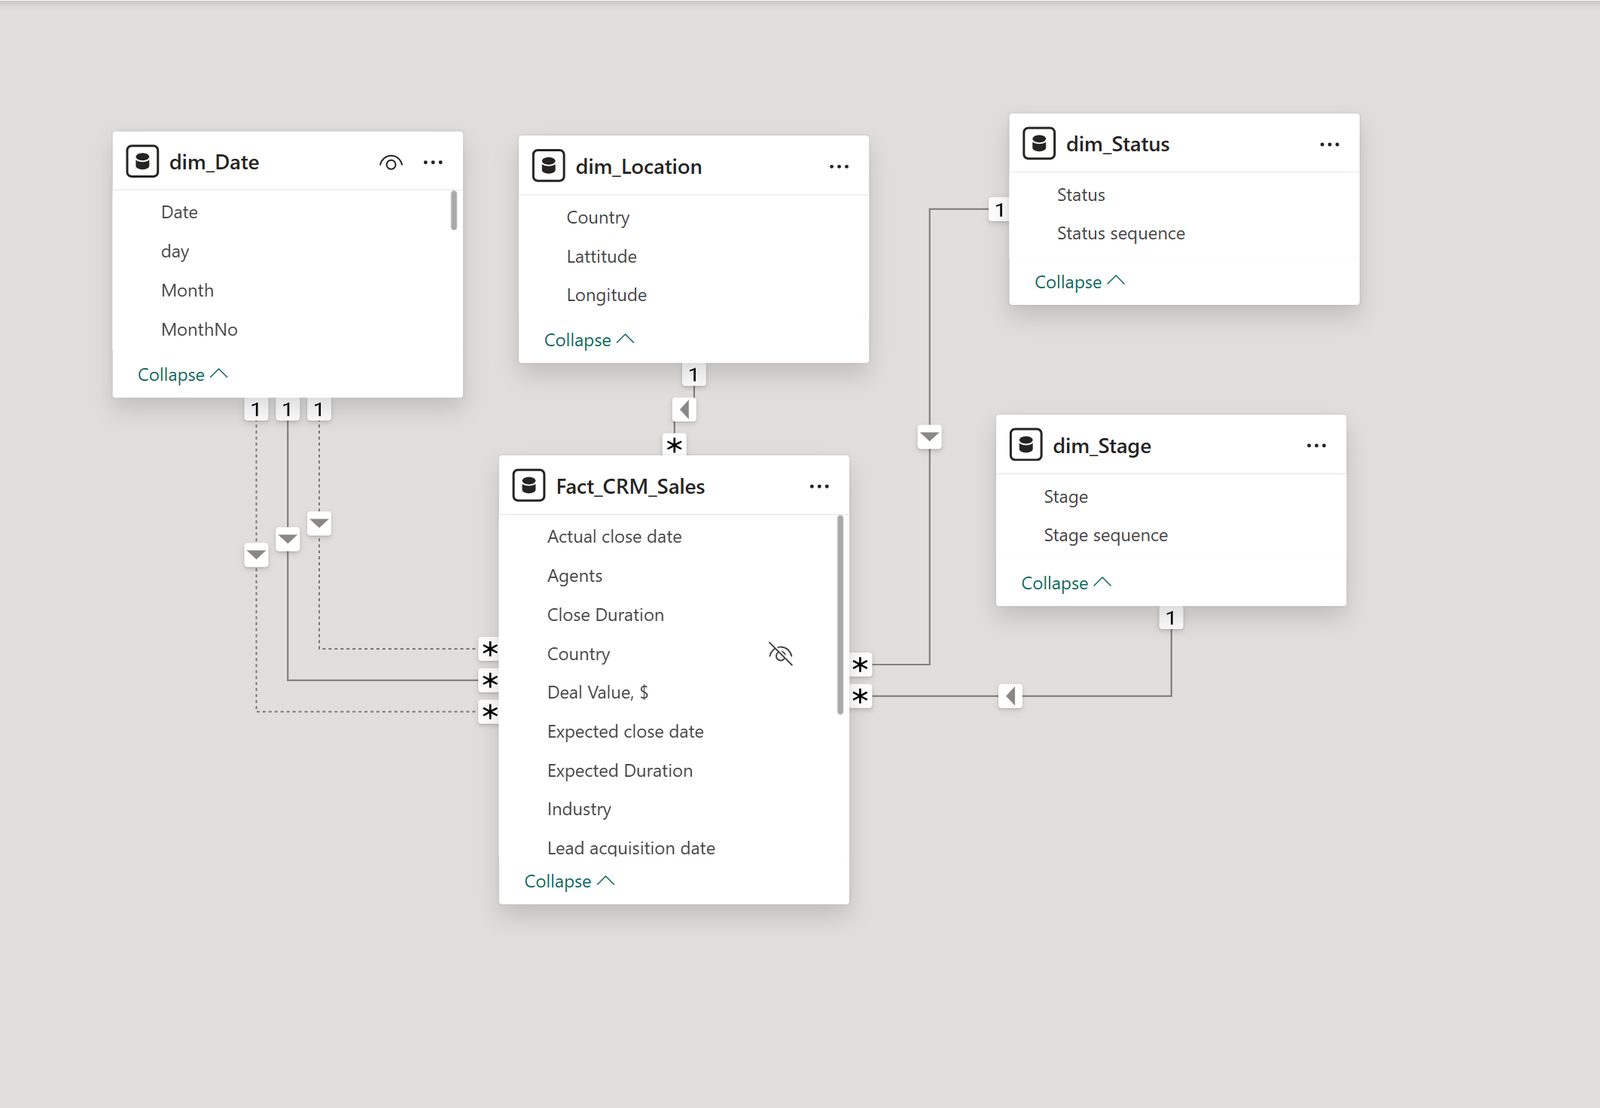
I set up a scheduled pipeline connecting the SQL database to Power BI so the dashboard refreshes automatically from live data, and rebuilt the dataset into a proper star schema, enabling accurate time-based comparisons and eliminating duplication.
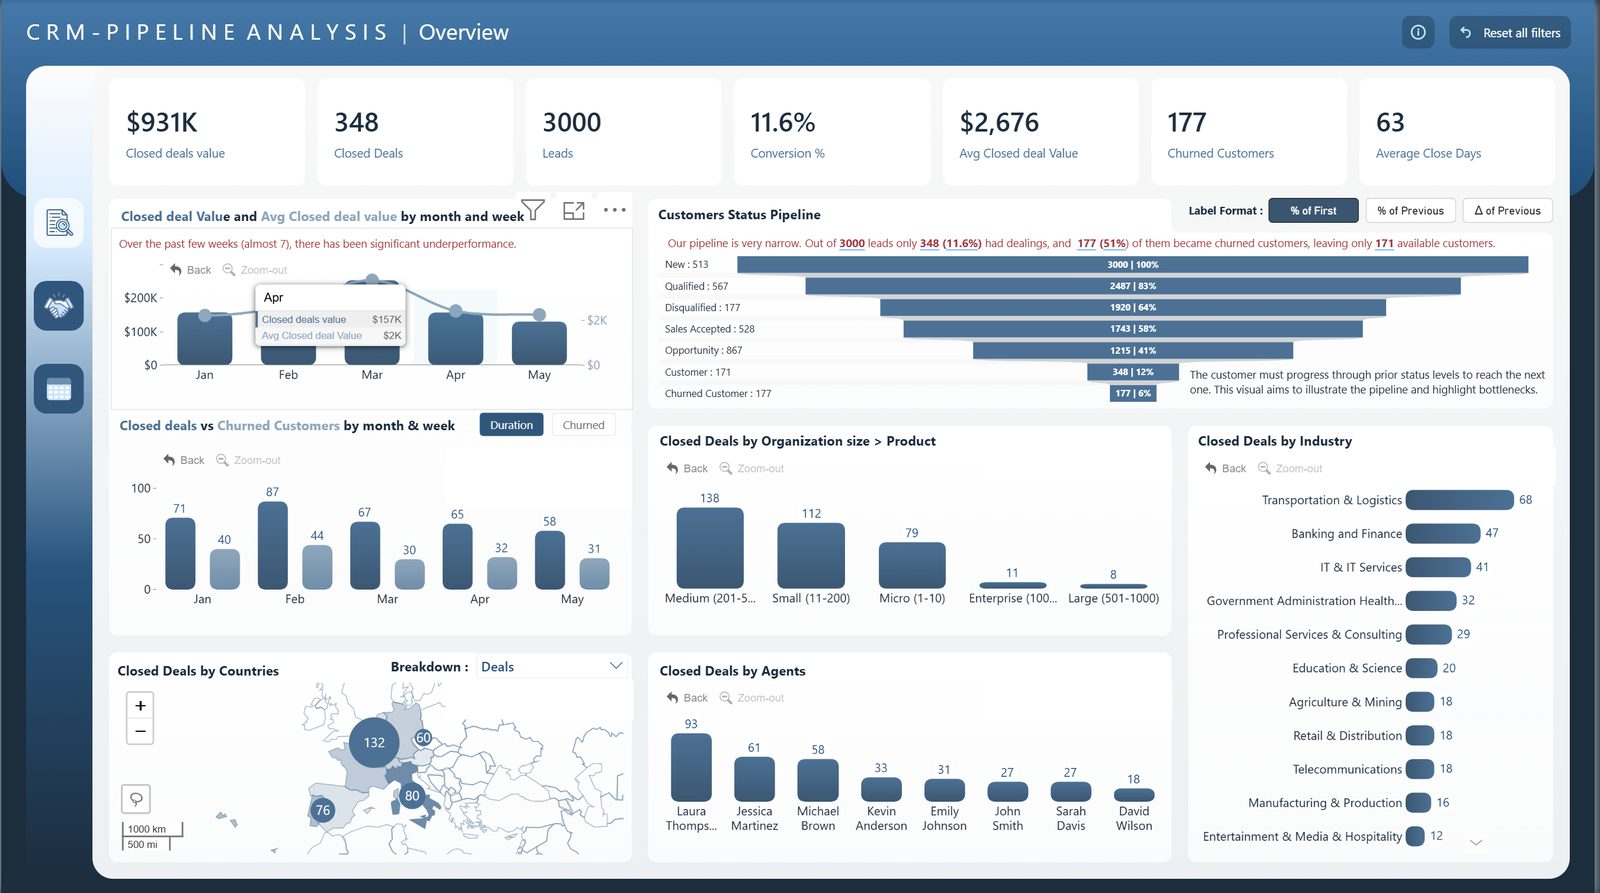
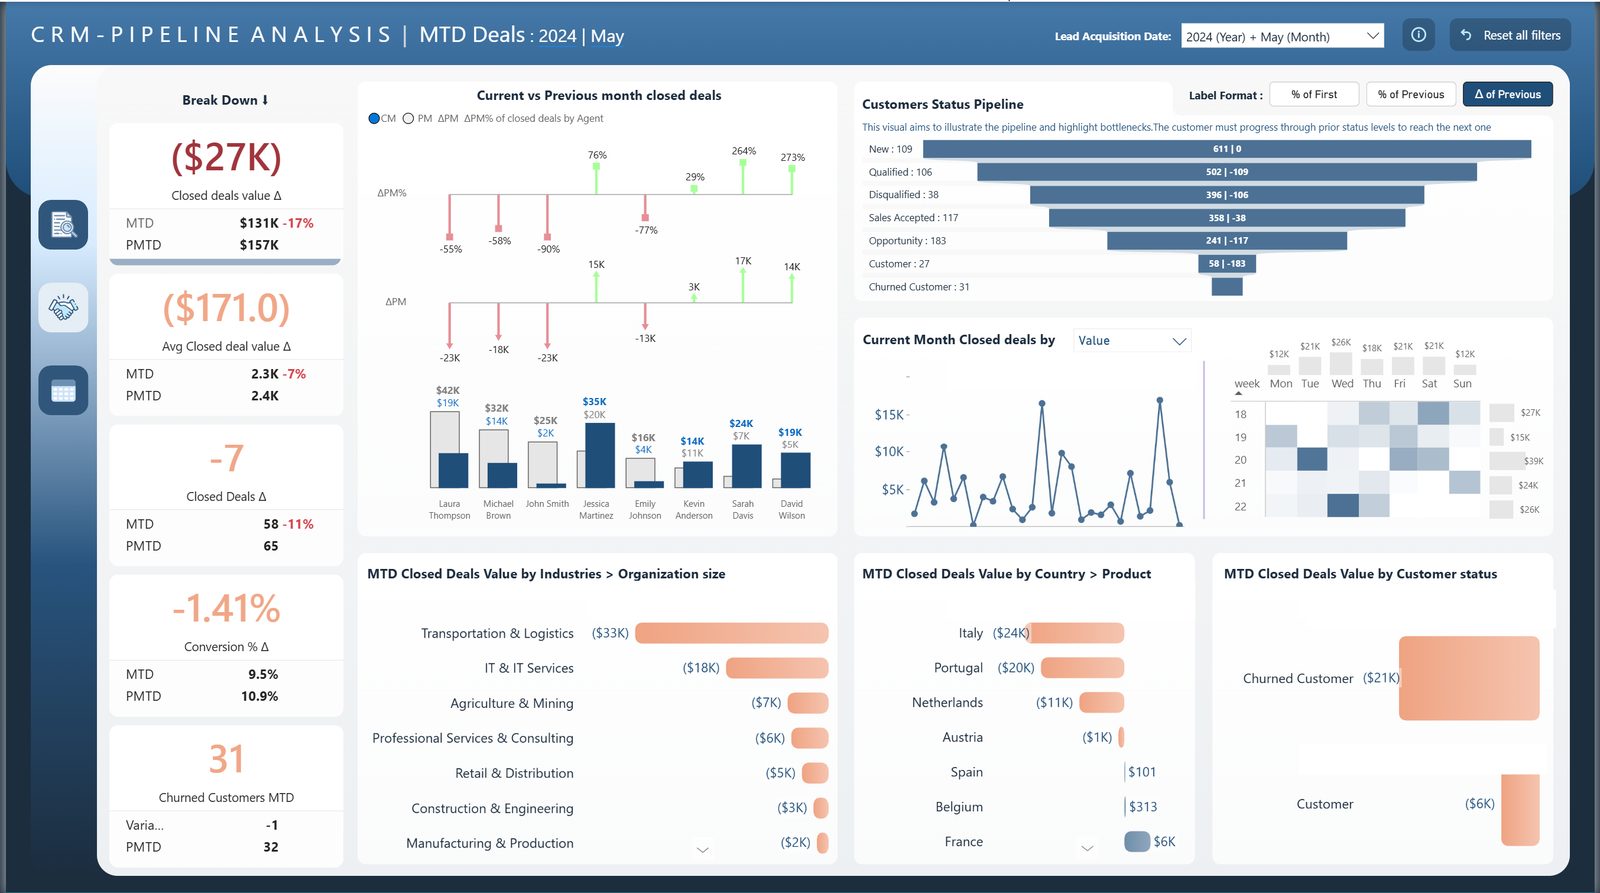
The critical piece was engineering custom sequencing logic for pipeline stages. The CRM had no built-in concept of stage order, so without this the funnel visual would have sorted alphabetically rather than representing reality. I also enriched the dataset with geocoded location data for an interactive map of deal activity by country, and built dynamic DAX time intelligence measures for month-over-month tracking with instant variance and percentage change.
The result
The dashboard gave leadership a live, single source of truth for the entire sales pipeline. It revealed that only 11.6% of leads were converting to closed deals, with the sharpest drop-off between the "Sales Accepted" and "Opportunity" stages — a bottleneck completely invisible in standard CRM reporting. It also exposed major performance gaps between agents (93 closed deals versus 18), giving sales management a data-backed starting point for coaching and pipeline strategy.
Tools & tech stack
- Data extractionREST API integration pulling leads, stages, agent activity and status history
- Data storage & cleaningSQL Server, T-SQL — deduplication, transformation, staging tables
- Data modelingStar schema design, Power Query (M)
- ReportingPower BI Desktop, DAX time intelligence and dynamic measures
- AutomationScheduled data refresh pipeline
- Geospatial enrichmentGeocoding integration for map visuals
Have a problem that looks like this one?
Tell me what you're trying to decide or automate, and I'll tell you honestly what it would take.