Call Centre Analytics Dashboard
A Python NLP layer added sentiment to 33,000 call records that had none — revealing negative sentiment outweighed positive nearly 3 to 1.
Power BI Development · Python Sentiment Analysis · Customer Service Operations
THE BUILD
click any screen to enlarge
My role
BI Consultant, Data Analyst & Python Developer — solo end-to-end from raw call logs to a live operational dashboard
The challenge
A multi-channel call centre operation spanning Call-Center, Chatbot, Email and Web had no way to see customer sentiment at scale. Management could track call volume and response times but had no visibility into how customers actually felt about those interactions, or whether certain reasons, channels or cities were driving disproportionately negative experiences. Nearly 33,000 call records existed as raw static data with no sentiment layer, no SLA breakdown logic and no consolidated reporting view.
The data problem
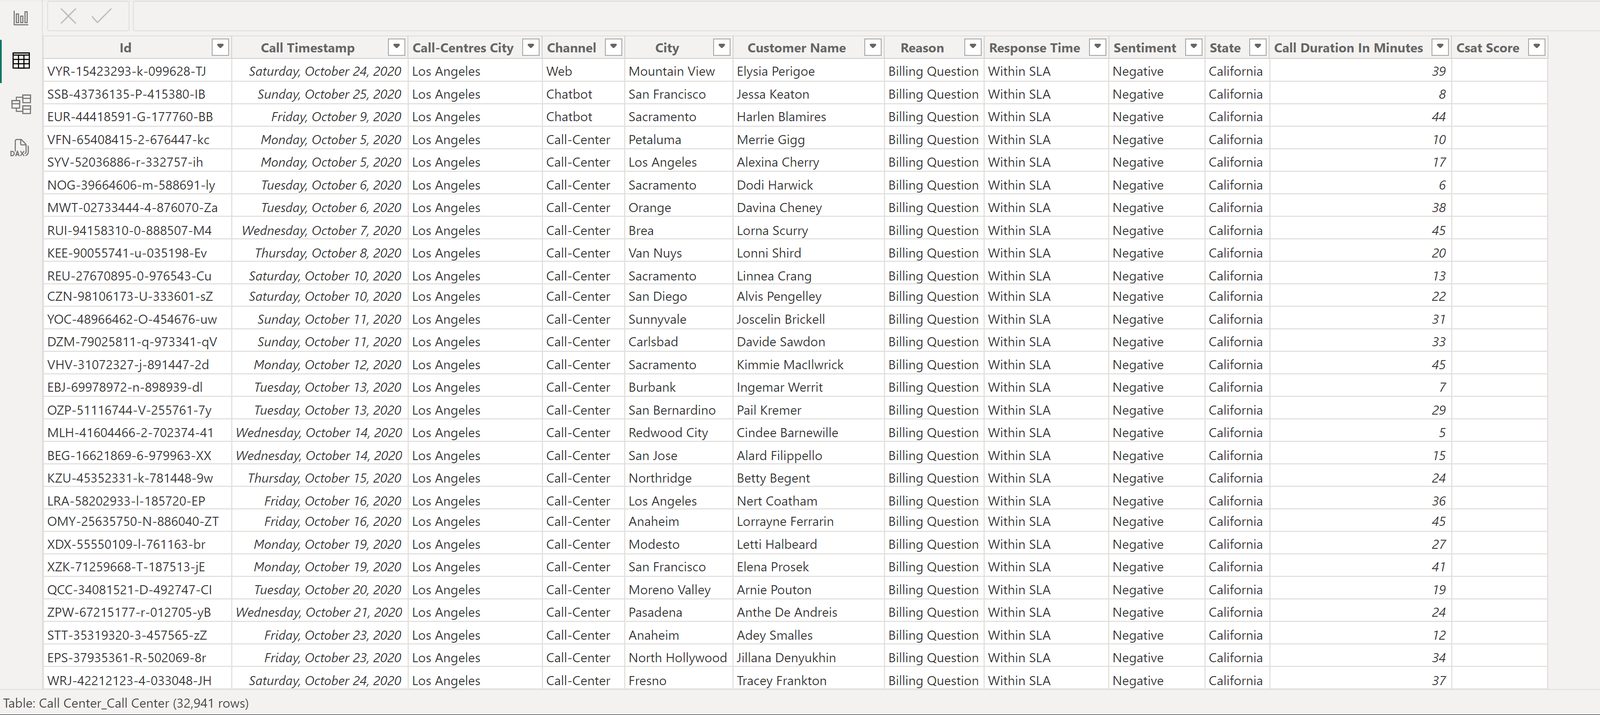
The source data came as static Excel exports covering call metadata, timestamps, channel, city, reason, response time and call duration — but with no sentiment or customer experience signal attached anywhere. Response time was logged as a raw duration with no SLA classification. Before any meaningful reporting could happen, the dataset needed both a sentiment layer added from scratch and consistent SLA categorization built on top of the raw timing data.
My approach
Since the raw call data had no sentiment field, I built a Python script using a natural language processing library (VADER/TextBlob-style sentiment scoring) to analyze the customer interaction text and classify each record on a five-point scale from Very Negative to Very Positive. This turned a purely operational dataset into one that could answer "how are customers feeling?", not just "how many calls came in?"
Once the sentiment scores were generated, I brought the enriched dataset into Power BI and used Power Query to build the SLA classification logic (Within SLA, Above SLA, Below SLA) based on each record's response time against defined thresholds, since the raw data only had a duration figure with no pass/fail categorization. I also cleaned and standardized the channel, city and reason fields to support consistent grouping and filtering across nearly 33,000 rows.
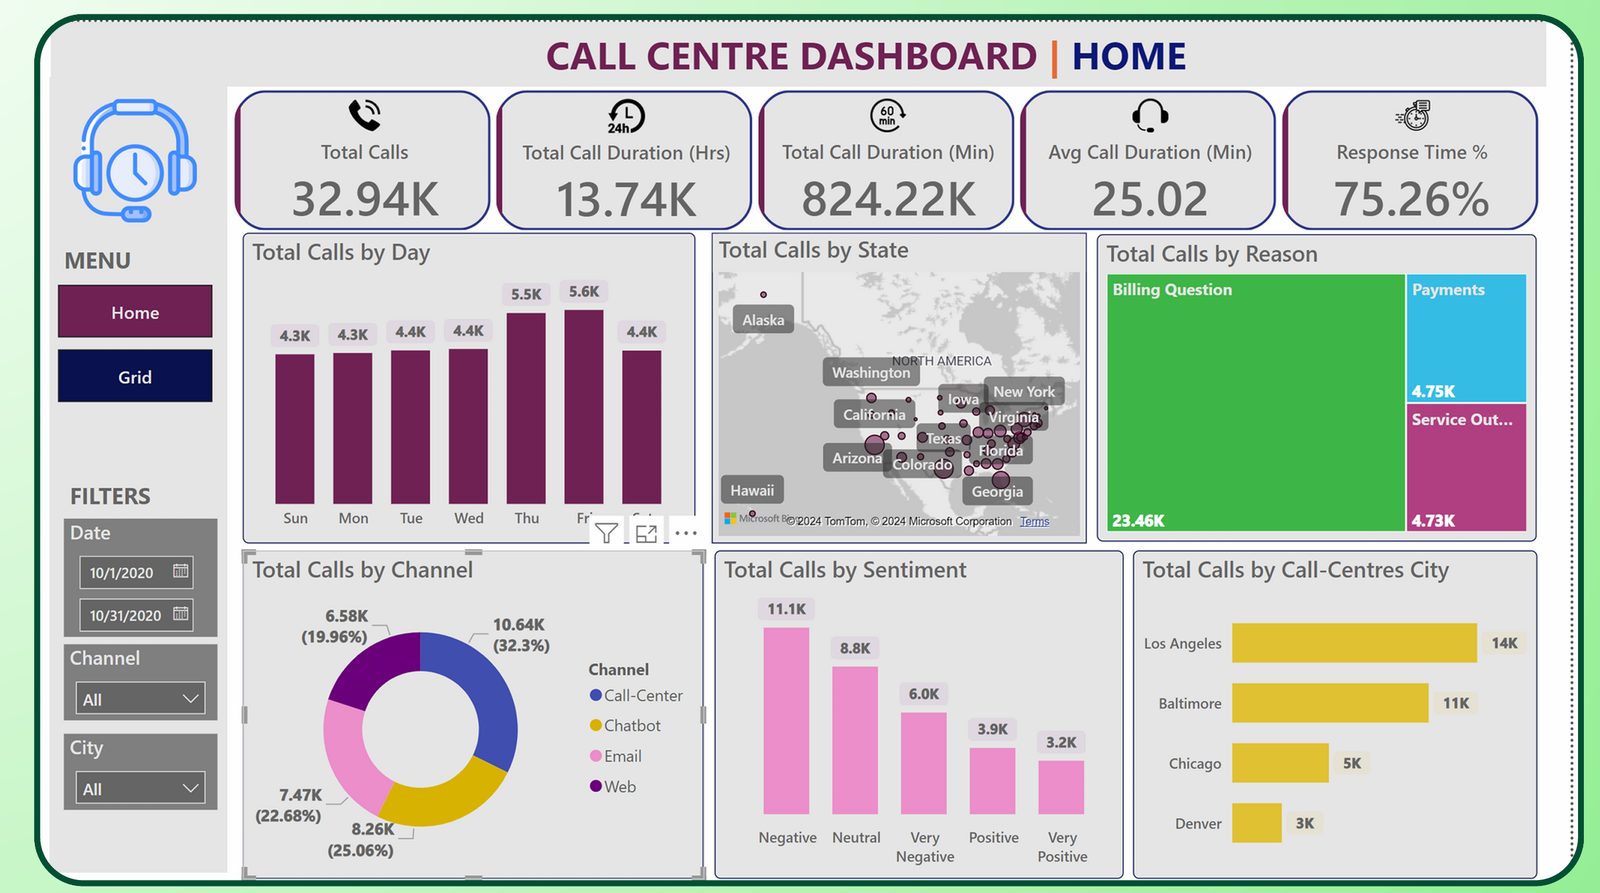
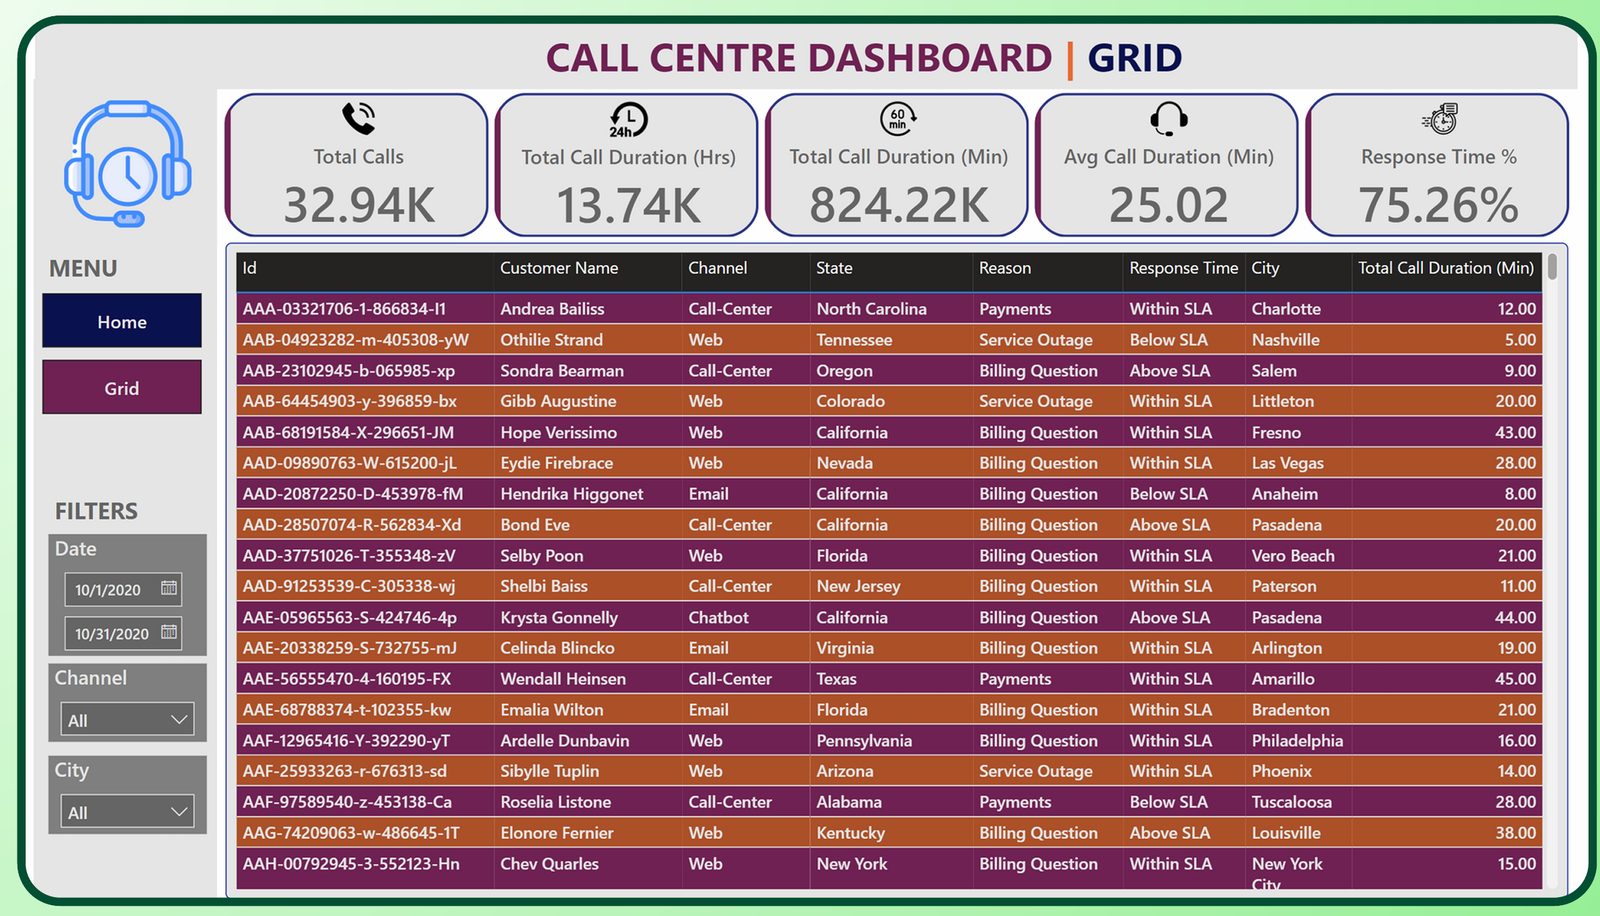
I structured the report around two views: a Home page giving a fast operational read — total calls, average call duration and response time percentage, alongside breakdowns by day, state (using a geographic bubble map), reason, channel, sentiment and call centre city — and a Grid page giving support teams a fully filterable, record-level table for case-by-case lookups by date range, channel and city.
The result
The dashboard gave leadership a sentiment-aware view of call centre performance for the first time. It revealed that negative and very negative sentiment together outweighed positive and very positive combined (roughly 19.9K versus 7.1K calls) — a clear signal of a broad customer experience issue rather than isolated incidents. It also showed billing questions driving 23.46K of roughly 32.9K total calls, giving the business a specific, high-leverage area to target for process improvement or self-service deflection.
Tools & tech stack
- Python (NLP / sentiment analysis)Generating sentiment classification from raw call interaction data, since no sentiment signal existed in the source
- Power Query (M)Cleaning, standardizing and building SLA classification logic from raw response time data
- Power BI & DAXReporting layer, KPI cards and cross-filterable visuals across day, state, channel, reason and sentiment
- Geospatial visualizationBubble map for call volume by state
- Data structureSingle consolidated call record table (~33K rows) enriched with a Python-generated sentiment dimension
Have a problem that looks like this one?
Tell me what you're trying to decide or automate, and I'll tell you honestly what it would take.